2.
Measurement Process Characterization
2.3.
Calibration
2.3.7.
Instrument control for linear calibration
2.3.7.1.
|
Control chart for a linear calibration line
|
|
|
Purpose
|
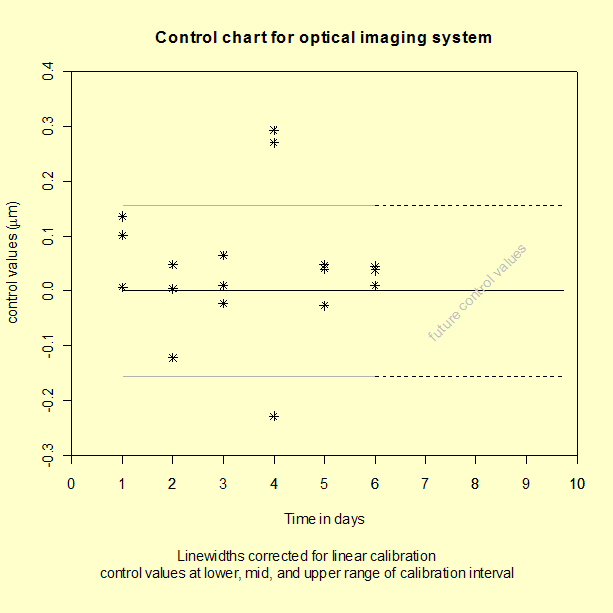
Line widths of three photomask reference standards (at the low,
middle and high end of the calibration line) were measured on six days
with an optical imaging system that had been calibrated from similar
measurements on 10 reference artifacts. The
control values and
limits for the control chart , which
depend on the intercept and slope of the linear calibration line,
monitor the calibration and linearity of the optical imaging system.
|
|
Initial calibration experiment
|
The initial calibration experiment consisted of 40 measurements (not
shown here) on 10 artifacts and produced a linear calibration line
with:
- Intercept = 0.2357
- Slope = 0.9870
- Residual standard deviation = 0.06203 micrometers
- Degrees of freedom = 38
|
|
Line width measurements made with an optical imaging system
|
The control measurements, Y, and known values, X, for the
three artifacts at the upper, mid-range, and lower end (U, M, L) of
the calibration line are shown in the following table:
DAY POSITION    X        Y

 1    L       0.76    1.12
 1    M       3.29    3.49
 1    U       8.89    9.11
 2    L       0.76    0.99
 2    M       3.29    3.53
 2    U       8.89    8.89
 3    L       0.76    1.05
 3    M       3.29    3.46
 3    U       8.89    9.02
 4    L       0.76    0.76
 4    M       3.29    3.75
 4    U       8.89    9.30
 5    L       0.76    0.96
 5    M       3.29    3.53
 5    U       8.89    9.05
 6    L       0.76    1.03
 6    M       3.29    3.52
 6    U       8.89    9.02
|
|
Control chart
|
The control chart shown below can be generated using both
Dataplot code and
R code. The reader can download the
data as a text file.

|
|
Interpretation of control chart
|
The control measurements show no evidence of drift and are within the
control limits except on the fourth day when all three control values
are outside the limits. The cause of the problem on that day cannot
be diagnosed from the data at hand, but all measurements made on that
day, including workload items, should be rejected and remeasured.
|


