2.
Measurement Process Characterization
2.3.
Calibration
2.3.5.
Control of artifact calibration
2.3.5.2.
Control of bias and long-term variability
2.3.5.2.1.
|
Example of Shewhart control chart for mass calibrations
|
|
|
Example of a control chart for mass calibrations
at the kilogram level
|
Mass calibrations usually start with the comparison of four kilogram
standards using a high precision balance as a comparator. Many of the
measurements at the kilogram level that were made at NIST between 1975
and 1989 were made on balance #12 using a
1,1,1,1 calibration design. The restraint
for this design is the known average of two kilogram reference
standards. The redundancy in the calibration design produces individual
estimates for the two test kilograms and the two reference standards.
|
|
Check standard
|
There is no slot in the 1,1,1,1 design for an artifact check standard
when the first two kilograms are reference standards; the third
kilogram is a test weight; and the fourth is a summation of smaller
weights that act as the restraint in the next series. Therefore, the
check standard is a computed difference between the values of the two
reference standards as estimated from the design. The convention with
mass calibrations is to report the correction to nominal, in this case
the correction to 1000 g, as shown in the control charts below.
|
|
Need for monitoring
|
The kilogram check standard is monitored to check for:
- Long-term degradation in the calibration process
- Anomalous behavior at specific times
|
|
Monitoring technique for check standard values
|
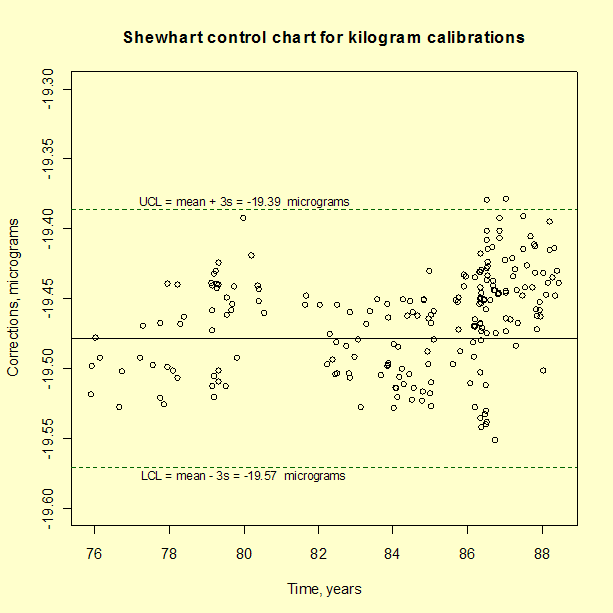
Check standard values over time and many calibrations are tracked and
monitored using a Shewhart control chart.
The database and control limits are updated when needed and check
standard values for each calibration run in the next cycle are compared
with the control limits. In this case, the values from 117
calibrations between 1975 and 1985 were averaged to obtain a
baseline and process standard
deviation with v = 116 degrees of freedom.
Control limits are computed
with a factor of
k = 3 to identify truly anomalous data points.
|
|
Control chart of kilogram check standard measurements
showing a change in the process after 1985
|

|
|
Interpretation of the control chart
|
The control chart shows only two violations of the control limits. For
those occasions, the calibrations were discarded and repeated. The
configuration of points is unacceptable if many points are close to a
control limit and there is an unequal distribution of data points on
the two sides of the control chart -- indicating a change in either:
- process average which may be related to a change in the
reference standards
or
- variability which may be caused by a change in the instrument
precision or may be the result of other factors on the
measurement process.
|
|
Small changes only become obvious over time
|
Unfortunately, it takes time for the patterns in the data to emerge
because individual violations of the control limits do not necessarily
point to a permanent shift in the process. The Shewhart control chart
is not powerful for detecting small changes, say of the order of at
most one standard deviation, which appears to be approximately the case
in this application. This level of change might seem insignificant,
but the calculation of uncertainties
for the calibration process depends on the control limits.
|
|
Re-establishing the limits based on recent data and EWMA option
|
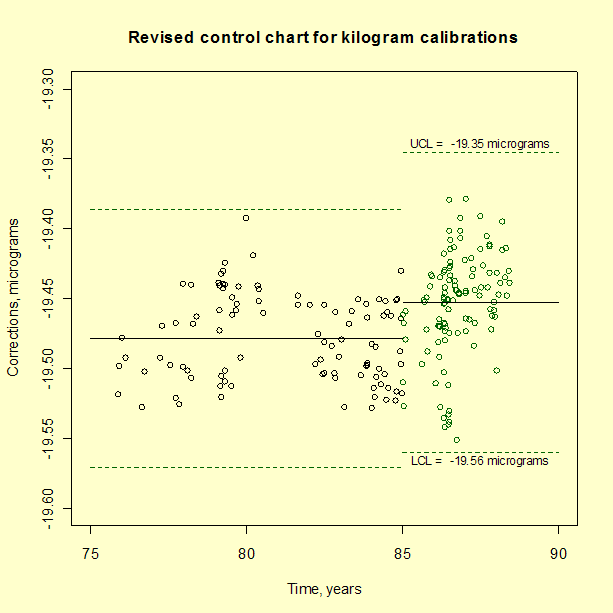
If the limits for the control chart are re-calculated based on the
data after 1985, the extent of the change is obvious. Because the
exponentially weighted moving average (EWMA) control chart is capable
of detecting small changes, it may be a better choice for a high
precision process that is producing many control values.
|
|
Revised control chart based on check standard measurements
after 1985
|

|
|
Sample code
|
The original and revised Shewhart control charts can be generated using both
Dataplot code and
R code. The reader can download the
data as a text file.
|


