2.
Measurement Process Characterization
2.2.
Statistical control of a measurement process
2.2.2.
How are bias and variability controlled?
|
|
Measurements should cover a sufficiently long time period to cover
all environmental conditions
|
A schedule should be set up for making measurements on the artifact
(check standard) chosen for control purposes. The measurements are
structured to sample all environmental conditions in the laboratory and
all other sources of influence on the measurement result, such as
operators and instruments.
For high-precision processes where the uncertainty of the result must
be guaranteed, a measurement on the check standard should be included
with every measurement sequence, if possible, and at least once a day.
For each occasion, J measurements are made on the check standard.
If there is no interest in controlling the short-term variability or
precision of the instrument, then one measurement is sufficient.
However, a dual purpose is served by making two or three measurements
that track both the bias and the short-term variability of the process
with the same database.
|
|
Depiction of check standard measurements with J = 4 repetitions
per day on the surface of a silicon wafer over K days where the
repetitions are randomized over position on the wafer
|
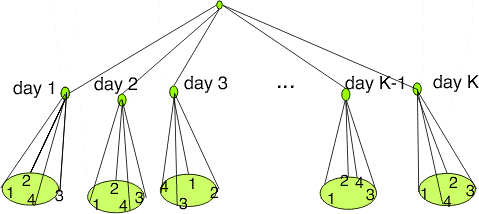 K days - 4 repetitions
2-level design for measurements on a check standard
|
|
Notation
|
For J measurements on each of K days, the measurements
are denoted by
$$Y_{kj}(k=1, \,\ldots, \, K, \,\, j=1, \,\ldots, \, J) \,\, . $$
|
|
The check standard value is defined as an average
of short-term repetitions
|
The check standard value for the kth day is
$$\overline{Y}_{k \, \small{\bullet}} = \frac{1}{J}\sum_{j=1}^{J} Y_{kj}$$
|
|
Accepted value of check standard
|
The accepted value, or baseline for the control chart, is
$$\overline{Y}_{\small{\bullet} \small{\bullet}} = \frac{1}{K} \sum_{k=1}^{K} \overline{Y}_{k \, \small{\bullet}}$$
|
|
Process standard deviation
|
The process standard deviation is
$${\large s}_2 = \sqrt{\frac{1}{K-1} \sum_{k=1}^{K} \left( \overline{Y}_{k \, \small{\bullet}} - \overline{Y}_{\small{\bullet} \small{\bullet}} \right) ^2}$$
|
|
Caution
|
Check standard measurements should be structured in the same way as
values reported on the test items. For example, if the reported values
are averages of two measurements made within 5 minutes of each other,
the check standard values should be averages of the two measurements
made in the same manner.
|
|
Database
Case study: Resistivity
|
Averages and short-term standard deviations computed from J
repetitions should be recorded in a file along with identifications for
all significant factors. The best way to record this information is
to use one file with one line (row in a spreadsheet) of information in
fixed fields for each group. A list of typical entries follows:
- Month
- Day
- Year
- Check standard identification
- Identification for the measurement design (if applicable)
- Instrument identification
- Check standard value
- Repeatability (short-term) standard deviation from J
repetitions
- Degrees of freedom
- Operator identification
- Environmental readings (if pertinent)
|

