1.4. EDA Case Studies
1.4.2. Case Studies
1.4.2.10. Ceramic Strength
1.4.2.10.4. |
Analysis of the Lab Effect |

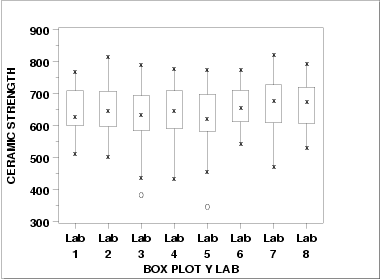
This box plot shows the following.
- There is minor variation in the medians for the
8 labs.
- The scales are relatively constant for the labs.
- Two of the labs (3 and 5) have outliers on the low side.

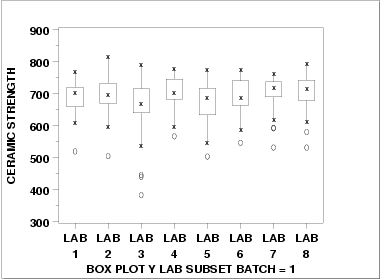
This box plot shows the following.
- Each of the labs has a median in the 650 to 700 range.
- The variability is relatively constant across the labs.
- Each of the labs has at least one outlier on the low side.

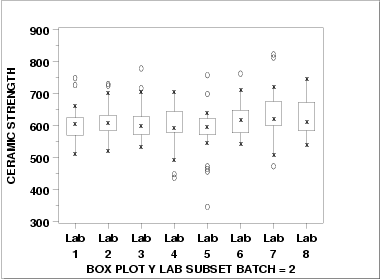
This box plot shows the following.
- The medians are in the range 550 to 600.
- There is a bit more variability, across the labs,
for batch2 compared to batch 1.
- Six of the eight labs show outliers on the high side. Three of the labs show outliers on the low side.
- The batch effect (of approximately 75 to 100 units) on
location dominates any lab effects.
- It is reasonable to treat the labs as homogeneous.

