1.3. EDA Techniques
1.3.3. Graphical Techniques: Alphabetic
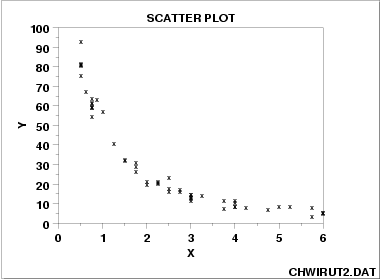
1.3.3.26. Scatter Plot
1.3.3.26.6. |
Scatter Plot: Exponential Relationship |
-
\[ Y_{i} = A + B e^{CX_{i}} + E_{i} \]

|
1.
Exploratory Data Analysis
1.3. EDA Techniques 1.3.3. Graphical Techniques: Alphabetic 1.3.3.26. Scatter Plot
|
|||
| Scatter Plot Showing Exponential Relationship |
|
||
| Discussion |
Note that a simple straight line is grossly inadequate in
describing the relationship between X and Y in this
plot of the CHWIRUT2.DAT
data set. A quadratic model would prove lacking, especially for
large values of X. In this example, the large values of
X correspond to nearly constant values of Y, and so a
non-linear function beyond the quadratic is needed. Among the
many other non-linear functions available, one of the simpler
ones is the exponential model
|
||
