Next Page Previous Page Home Tools & Aids Search Handbook
1. Exploratory Data Analysis
1.3. EDA Techniques
1.3.3. Graphical Techniques: Alphabetic
1.3.3.21. Normal Probability Plot

1.3.3.21.3.

Normal Probability Plot: Data Have Long Tails

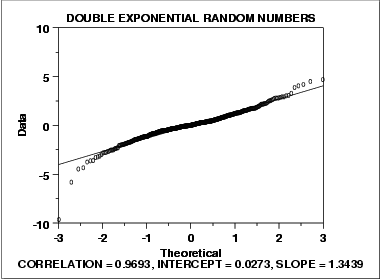
Normal Probability Plot for Data with Long Tails The following is a normal probability plot of 500 numbers generated from a double exponential distribution. The double exponential distribution is symmetric, but relative to the normal it declines rapidly and has longer tails.

normal probability plot for data with long tails

Conclusions We can make the following conclusions from the above plot.
  1. The normal probability plot shows a reasonably linear pattern in the center of the data. However, the tails, particularly the lower tail, show departures from the fitted line.
  2. A distribution other than the normal distribution would be a good model for these data.
Discussion For data with long tails relative to the normal distribution, the non-linearity of the normal probability plot can show up in two ways. First, the middle of the data may show an S-like pattern. This is common for both short and long tails. In this particular case, the S pattern in the middle is fairly mild. Second, the first few and the last few points show marked departure from the reference fitted line. In the plot above, this is most noticeable for the first few data points. In comparing this plot to the short-tail example in the previous section, the important difference is the direction of the departure from the fitted line for the first few and the last few points. For long tails, the first few points show increasing departure from the fitted line below the line and last few points show increasing departure from the fitted line above the line. For short tails, this pattern is reversed.

In this case we can reasonably conclude that the normal distribution can be improved upon as a model for these data. For probability plots that indicate long-tailed distributions, the next step might be to generate a Tukey Lambda PPCC plot. The Tukey Lambda PPCC plot can often be helpful in identifying an appropriate distributional family.

Home Tools & Aids Search Handbook Previous Page Next Page