1.3. EDA Techniques
1.3.3. Graphical Techniques: Alphabetic
1.3.3.18. |
Linear Slope Plot |
Detect changes in linear slopes between groups
Linear slope plots are typically used in conjunction with linear intercept and linear residual standard deviation plots.
In some cases you might not have groups. Instead, you have different data sets and you want to know if the same fit can be adequately applied to each of the data sets. In this case, simply think of each distinct data set as a group and apply the linear slope plot as for groups.

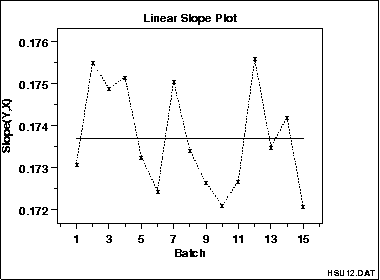
This linear slope plot of the HSU12.DAT data set shows that the slopes are about 0.174 (plus or minus 0.002) for all groups. There does not appear to be a pattern in the variation of the slopes. This implies that a single fit may be adequate.
Group Slopes Versus Group ID
- Vertical axis: Group slopes from linear fits
- Horizontal axis: Group identifier
- Do you get the same slope across groups for linear fits?
- If the slopes differ, is there a discernible pattern in the slopes?
Checking Group Homogeneity
Linear Correlation Plot
Linear Residual Standard Deviation Plot
Linear Fitting

