1.3. EDA Techniques
1.3.3. Graphical Techniques: Alphabetic
1.3.3.14. Histogram
1.3.3.14.1. |
Histogram Interpretation: Normal |
Tailed Histogram

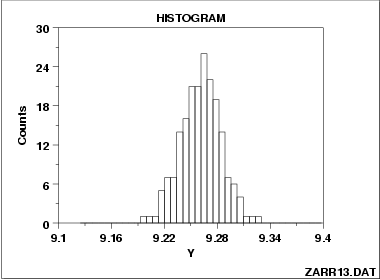
Note the classical bell-shaped, symmetric histogram with most of the frequency counts bunched in the middle and with the counts dying off out in the tails. From a physical science/engineering point of view, the normal distribution is that distribution which occurs most often in nature (due in part to the central limit theorem).

