1.3. EDA Techniques
1.3.3. Graphical Techniques: Alphabetic
1.3.3.26. Scatter Plot
1.3.3.26.5. |
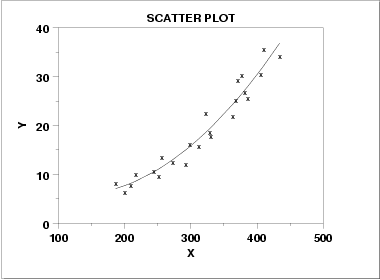
Scatter Plot: Quadratic Relationship |

-
\[ Y_{i} = A + BX_{i} + CX_{i}^{2} + E_{i} \]

|
1.
Exploratory Data Analysis
1.3. EDA Techniques 1.3.3. Graphical Techniques: Alphabetic 1.3.3.26. Scatter Plot
|
|||
| Scatter Plot Showing Quadratic Relationship |

|
||
| Discussion |
Note in the plot above how no imaginable simple straight line
could ever adequately describe the relationship between X
and Y--a curved (or curvilinear, or non-linear) function
is needed. The simplest such curvilinear function is a quadratic
model
|
||
