
1.3. EDA Techniques
1.3.3. Graphical Techniques: Alphabetic
1.3.3.25. Scatter Plot
1.3.3.25.9. Scatter Plot: Variation of Y Does Depend on X (heteroscedastic)
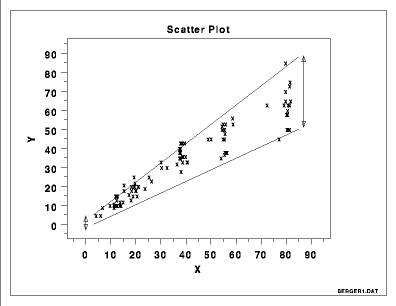
Heteroscasticity is serious-- its existence invalidates the usual estimates that result from regression (because regression code assumes all of the Y-data are equally precise, and clearly that is not the case here--values of Y for large X are much less precise). If heteroscedastic, then avoid the usual regression estimates and replace them with 1) weighted regression (with noisier data being weighted less); or 2) Y-variable transformation (to achieve homoscasticity (= "one variation") in the transformed variable). For details, see chapter 3.
