1.3. EDA Techniques
1.3.3. Graphical Techniques: Alphabetic
1.3.3.10. Histogram
1.3.3.10.4. Histogram Interpretation: Symmetric and Bimodal

For many phenomena, it is quite common for the distribution of the response values to be unimodel, that is, the data values tend to cluster around a single mode and then distribute themselves with lesser frequency out into the tails. The commonly-encountered bell-shaped normal 9= Gaussian) distribution is the classic example of a unimodal distribution.
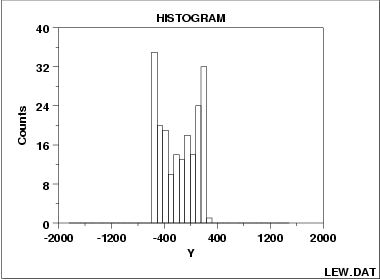
The histogram shown above illustrates data from a bimodal (= 2 peak) distribution. If non-unimodality exists, it is important that the analyst be aware of it. As with many of the EDA techniques, the histogram serves as a nice diagnostic tool for increasing such awareness. Questioning as to why such distributional non-unimodality exists frequently leads to greater insight and improved deterministic modeling of the phenomenon under study. (For example, for the data presented above, the bimodal histogram was caused by a deterministic sinusoidality in the data).
Recommended Next Steps

