1.
Exploratory Data Analysis
1.3.
EDA Techniques
1.3.3.
Graphical Techniques: Alphabetic
|
Purpose:
Interlab Comparisons
|
Youden plots are a graphical technique for analyzing
interlab data when each lab has made two runs on the
same product or one run on two different products.
The Youden plot is a simple but effective method for
comparing both the within-laboratory variability and
the between-laboratory variability.
|
|
Sample Plot
|
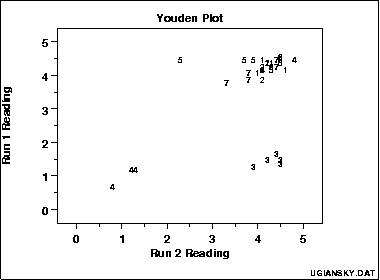
This plot shows:
- Not all labs are equivalent.
- Lab 4 is biased low.
- Lab 3 has within-lab variability problems.
- Lab 5 has an outlying run.
|
Definition:
Response 1 Versus Response 2 Coded by Lab
|
Youden plots are formed by:
- Vertical axis: Response variable 1 (i.e., run 1 or
product 1 response value)
- Horizontal axis: Response variable 2 (i.e., run 2 or
product 2 response value)
In addition, the plot symbol is the lab id (typically an
integer from 1 to k where k is the number of
labs). Sometimes a 45-degree reference line is drawn.
Ideally, a lab generating two runs of the same product should
produce reasonably similar results. Departures from this
reference line indicate inconsistency from the lab. If two
different products are being tested, then a 45-degree line
may not be appropriate. However, if the labs are consistent,
the points should lie near some fitted straight line.
|
|
Questions
|
The Youden plot can be used to answer the following
questions:
- Are all labs equivalent?
- What labs have between-lab problems (reproducibility)?
- What labs have within-lab problems (repeatability)?
- What labs are outliers?
|
Importance
|
In interlaboratory studies or in comparing two runs from
the same lab, it is useful to know if consistent results
are generated. Youden plots should be a routine plot
for analyzing this type of data.
|
|
DOE Youden Plot
|
The DOE Youden plot is a specialized
Youden plot used in the design of experiments. In particular,
it is useful for
full and
fractional designs.
|
|
Related Techniques
|
Scatter Plot
|
|
Software
|
The Youden plot is essentially a scatter plot, so it should be
feasible to write a macro for a Youden plot in any general
purpose statistical program that supports scatter plots.
|

