1.3. EDA Techniques
1.3.3. Graphical Techniques: Alphabetic
1.3.3.26. Scatter Plot
1.3.3.26.12. |
Conditioning Plot |
Check pairwise relationship between two variables conditional on a third variable
One limitation of the scatter plot matrix is that it cannot show interaction effects with another variable. This is the strength of the conditioning plot. It is also useful for displaying scatter plots for groups in the data. Although these groups can also be plotted on a single plot with different plot symbols, it can often be visually easier to distinguish the groups using the conditional plot.
Although the basic concept of the conditioning plot matrix is simple, there are numerous alternatives in the details of the plots.
- It can be helpful to overlay some type of fitted curve
on the scatter plot. Although a linear or quadratic fit
can be used, the most common alternative is to overlay
a lowess
curve.
- Due to the potentially large number of plots, it can be
somewhat tricky to provide the axes labels in a way that is
both informative and visually pleasing. One alternative that
seems to work well is to provide axes labels on alternating
rows and columns. That is, row one will have tic marks
and axis labels on the left vertical axis for the first
plot only while row two will have the tic marks and axis
labels for the right vertical axis for the last plot in the
row only. This alternating pattern continues for the
remaining rows. A similar pattern is used for the columns
and the horizontal axes labels. Note that this approach only
works if the axes limits are fixed to common values for all
of the plots.
- Some analysts prefer to connect the scatter plots. Others
prefer to leave a little gap between each plot. Alternatively,
each plot can have its own labeling with the plots not
connected.
- Although this plot type is most commonly used for scatter plots, the basic concept is both simple and powerful and extends easily to other plot formats.

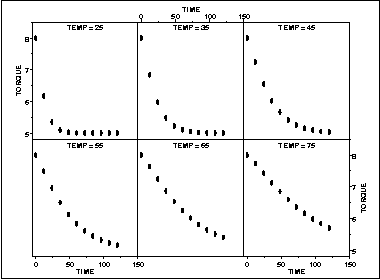
In this case, temperature has six distinct values. We plot torque versus time for each of these temperatures. This example is discussed in more detail in the process modeling chapter.
The individual plot for row i and column j is defined as
- Vertical axis: Variable Y
- Horizontal axis: Variable X
where only the points in the group corresponding to the ith row and jth column are used.
- Is there a relationship between two variables?
- If there is a relationship, does the nature of this relationship depend on the value of a third variable?
- Do groups in the data behave in a similar way?
- Are there outliers in the data?
Scatter plot matrix
Locally weighted least squares

