1.3. EDA Techniques
1.3.3. Graphical Techniques: Alphabetic
1.3.3.1. Autocorrelation Plot
1.3.3.1.4. |
Autocorrelation Plot: Sinusoidal Model |

- The data come from an underlying sinusoidal model.

|
1.
Exploratory Data Analysis
1.3. EDA Techniques 1.3.3. Graphical Techniques: Alphabetic 1.3.3.1. Autocorrelation Plot
|
|||
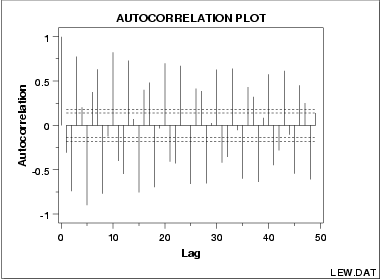
| Autocorrelation Plot for Sinusoidal Model |
The following is a sample autocorrelation plot of
the LEW.DAT data set.
|
||
| Conclusions |
We can make the following conclusions from the above plot.
|
||
| Discussion | The plot exhibits an alternating sequence of positive and negative spikes. These spikes are not decaying to zero. Such a pattern is the autocorrelation plot signature of a sinusoidal model. | ||
| Recommended Next Step | The beam deflection case study gives an example of modeling a sinusoidal model. | ||
