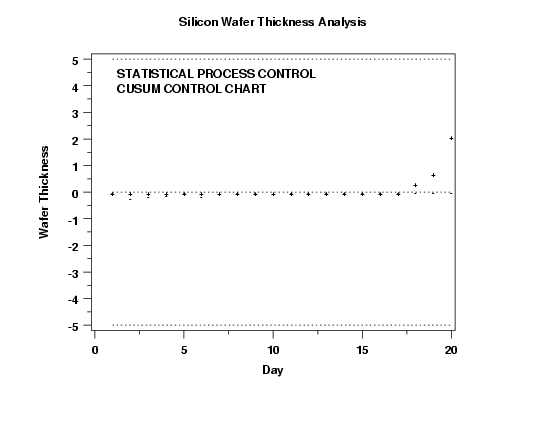
CUSUM CONTROL CHART
Name:
Type:
Purpose:
Generates a cumulative sum (CUSUM) control chart.
Description:
An cusum control chart is a data analysis analysis technique for
determining if a measurement process has gone out of statistical
control. Similar to the exponentially weighted moving average
control chart, it is better than the standard xbar control chart
for detecting small shifts in the process mean.
This command implements a mean cumulative sum control
chart.
There are numerous variations on how cusum control
charts are implemented. Dataplot follows the methods
discussed by Thomas Ryan in "Statistical Methods for
Quality Improvement". Dataplot does the following:
- Positive and negative sums are computed as follows:
\( S_{H_i} = \max{0,(z_i - k) + S_{H_{i-1}}} \)
\( S_{L_i} = \max{0,(-z_i - k) + S_{L_{i-1}}} \)
\( s_{H_i} \) and
\( S_{L_i} \) have initial values of 0 and zi is
the z-score of the ith group (that is, the
sub-group mean minus the overall mean divided by the standard
deviation of the subgroup averages.
Dataplot plots the negative of
\( S_{L_i} \)
to avoid overlap for the plottting of
\( S_{H_i} \) and \( S_{L_i} \).
That is,
\( S_{H_i} \) is plotted on the positive scale vertically and
\( S_{L_i} \) is plotted on the negative scale vertically.
The value of k is set to one half of the smallest
shift in location (in standard deviation units)
that you want to detect. Dataplot by default selects
a 1-sigma shift, that is k = 0.5. To overide this,
enter the command
- By defauult, Dataplot sets the control limit at
a value of 5. That is, if the one of the sums exceeds
5, the process is deemed out of control. To override
the default value, enter the command
The value for H is typically between 4 and 5.
In some cases, there may be historical data or engineering
considerations that determine the control limits. You can set
your own control limits by entering the commands:
LET TARGET = <value>
LET USL = <value>
LET LSL = <value>
where TARGET is the desired target value and USL and LSL are the
desired upper and lower control limits.
You can control the appearance of this chart by setting the
switches for the LINE, CHARACTER, SPIKE, and BAR commands
appropriately. Specifically,
|
Trace 1 =
|
the CUSUM statistic for positive sums
|
|
Trace 2 =
|
the CUSUM statistic for negative sums
|
|
Trace 3 =
|
Target reference line (the overall mean)
|
|
Trace 4 =
|
Dataplot calculated upper control limit
|
|
Trace 5 =
|
Dataplot calculated lower control limit
|
|
Trace 6 =
|
User specified target value
|
|
Trace 7 =
|
User specified upper control limit
|
|
Trace 8 =
|
User specified lower control limit
|
For example, to draw the EWMA values as a solid line and
an X, the reference line and the Dataplot calculated control
limits as dotted lines, and no user specified control limit,
enter the commands:
LINE SOLID DOTTED DOTTED DOTTED BLANK BLANK BLANK
CHARACTER X BLANK BLANK BLANK BLANK BLANK BLANK
Syntax:
CUSUM CONTROL CHART <y> <group>
<SUBSET/EXCEPT/FOR qualification>
where <y> is a response variable;
<group> is a sub-group identifier variable;
and where the <SUBSET/EXCEPT/FOR qualification> is optional.
Examples:
CUSUM CONTROL CHART Y1 X
CUSUM CONTROL CHART Y
CUSUM CONTROL CHART Y1 X SUBSET X > 1
Note:
The cusum technique can be applied to a variety of control chart
situations. Currently, Dataplot only supports cusum control charts
for the mean.
Note:
There are alternative methods for determining control limits
for the cusum chart. In particular, the V-mask is a common
technique. Dataplot does not support any V-mask techniques at
this time.
Note:
The Fast Intitial Response (FIR) cusum chart works by
providing inital values for the high and low sums. You
can implemment a FIR cusum chart in Dataplot by entering
the following commands before the CUSUM CONTROL CHART
command:
LET SHI = <value>
LET SLI = <value>
Using a start value of h/2, where h is described above,
is the common recommendation.
FIR cusum control charts are recommended for the case
where there may be multiple causes for an out-of-control
signal and you want to detect as quickly as possible if
the process is still out of control after the process is
restarted.
Default:
Synonyms:
CUSUM CHART is a synonym for CUSUM CONTROL CHART.
Related Commands:
|
CUSUM ARL
|
= Compute average run length for cusum chart.
|
|
XBAR CONTROL CHART
|
= Generates a mean control chart.
|
|
RANGE CONTROL CHART
|
= Generates a mean control chart.
|
|
S CONTROL CHART
|
= Generates a sd control chart.
|
|
EWMA CONTROL CHART
|
= Generates a ewma control chart.
|
|
HOTELLING CONTROL CHART
|
= Generates a Hotelling control chart.
|
|
MOVING AVERAGE CHART
|
= Generates a moving average control chart.
|
|
MOVING RANGE CHART
|
= Generates a moving range control chart.
|
|
MOVING SD CHART
|
= Generates a moving sd control chart.
|
|
C CHART
|
= Generates a C control chart.
|
|
U CHART
|
= Generates a U control chart.
|
|
P CHART
|
= Generates a P control chart.
|
|
NP CHART
|
= Generates an Np control chart.
|
Reference:
"Statistical Methods For Quality Improvement", Thomas Ryan,
John Wiley and Sons, 1989, pp. 122-124.
Applications:
Implementation Date:
Program:
TITLE Silicon Wafer Thickness Analysis
LABEL CASE ASIS
TITLE CASE ASIS
Y1LABEL Wafer Thickness
X1LABEL Day
LEGEND 1 Statistical Process Control
LEGEND 2 EWMA Control Chart
TIC OFFSET UNITS DATA
TIC OFFSET 0.2 0.2
.
SKIP 25
READ CCXBAR.DAT Y X
.
CHARACTER + - BLANK BLANK BLANK
LINE BLANK BLANK DOT DOT DOT
.
LET P = 0.5
CUSUM CONTROL CHART Y X

Date created: 06/05/2001
Last updated: 12/04/2023
Please email comments on this WWW page to
[email protected].
|
|

