
|
GHPDFName:

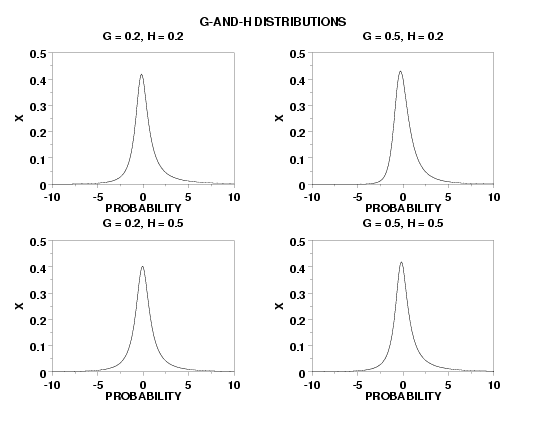
with Zp denoting the normal percent point function of p. When g = 0 and h = 0, the g-and-h distribution reduces to a standard normal distribution. The g-and-h probability density function is computed by taking the numerical derivative of the cumulative distribution function (which is turn computed by numerically inverting the percent point function using a bisection method). The value of g controls the degree of skewness. For g = 0, the distribution is symmetric. As the absolute value of g increases, the amount of the skewness increases. The sign of g controls the direction of the skewness (but not the amount). Positive values of g skew the distribution to the right tail while negative values of g skew the distribution to the left tail. Values for g are typically in the range (-1,1). The value of h controls the elongation, or how heavy the tails are, of the distribution. For h = 0, the elongation is equivalent to that of a normal distribution. For h = 1, the elongation is equivalent to that of a Cauchy distribution. Values of h are typically in the range (0,1). Specifying values for both g and h gives this distribution great flexibility in modeling data.
<SUBSET/EXCEPT/FOR qualification> where <x> is a variable, number, or parameter; <g> is a number or parameter that specifies the skewness shape parameter; <h> is a number or parameter that specifies the elongation shape parameter; <y> is a variable or a parameter (depending on what <x> is) where the computed g-and-h pdf value is stored; and where the <SUBSET/EXCEPT/FOR qualification> is optional. Note that the location and scale parameters are optional.
LET Y = GHPDF(X,0.5,0.2) PLOT GHPDF(X,0.5,0.2) FOR X = -5 0.1 5
LET H = <value> LET Y = GH RANDOM NUMBERS FOR I = 1 1 N GH PROBABILITY PLOT Y GH KOLMOGOROV SMIRNOV GOODNESS OF FIT Y GH CHI-SQUARE GOODNESS OF FIT Y The following commands can be used to estimate the shape parameters for the g-and-h distribution:
LET G2 = <value> LET H1 = <value> LET H2 = <value> GH PPCC PLOT Y GH KS PLOT Y The default values for G1 and G2 are -1 and 1. The default values of H1 and H2 are H1 and H2.
MULTIPLOT 2 2
MULTIPLOT SCALE FACTOR 2
MULTIPLOT CORNER COORDINATES 0 0 100 95
Y1LABEL X
X1LABEL PROBABILITY
X1LABEL DISPLACEMENT 12
Y1LABEL DISPLACEMENT 12
TITLE G = 0.2, H = 0.2
PLOT GHPDF(X,0.5,0.5) FOR X = -10  0.1  10
TITLE G = 0.5, H = 0.2
PLOT GHPDF(X,0.5,0.2) FOR X = -10  0.1  10
TITLE G = 0.2, H = 0.5
PLOT GHPDF(X,0.2,0.5) FOR X = -10  0.1  10
TITLE G = 0.5, H = 0.5
PLOT GHPDF(X,0.5,0.5) FOR X = -10  0.1  10
END OF MULTIPLOT
MOVE 50 97
JUSTIFICATION CENTER
TEXT G-AND-H DISTRIBUTIONS

Date created: 7/7/2004 |