
5.4. Analysis of DOE data
5.4.7. Examples of DOE's
5.4.7.3. |
Response surface model example |
To summarize, the goal is to obtain a response surface model for two responses, Uniformity and Stress. The factors are: Pressure and H2/WF6.
The minimum and maximum H2/WF6 ratios were chosen to be 2 and 10. Since response curvature, especially for Uniformity, was a distinct possibility, an experimental design that allowed estimating a second order (quadratic) model was needed. The experimenters decided to use a central composite inscribed (CCI) design. For two factors, this design is typically recommended to have 13 runs with 5 centerpoint runs. However, the experimenters, perhaps to conserve a limited supply of wafer resources, chose to include only 3 centerpoint runs. The design is still rotatable, but the uniform precision property has been sacrificed.
|
|
|
|
|
|
Pressure |
H2/WF6 |
|
|
|
|
|
|
|
|
|
|
|
|
|
|
|
|
|
|
|
|
|
|
|
|
|
|
|
|
|
|
|
|
|
|
|
|
|
|
|
|
|
|
|
|
|
|
|
|
|
|
|
|
|
|
|
|
|
|
|
|
|
|
|
|
|
|
|
|
|
|
|
|
|
|
|
|
|
|
|
|
|
|
|
|
|
|
|
|
The analyses shown in this page can be generated using R code.
- Fit the full model to the first response.
- Use stepwise regression, forward selection, or backward elimination to identify important variables.
- When selecting variables for inclusion in the model, follow the hierarchy principle and keep all main effects that are part of significant higher-order terms or interactions, even if the main effect p-value is larger than you would like (note that not all analysts agree with this principle).
- Generate diagnostic residual plots (histograms, box plots, normal plots, etc.) for the model selected.
- Examine the fitted model plot, interaction plots, and ANOVA statistics (R2, adjusted R2, lack-of-fit test, etc.). Use all these plots and statistics to determine whether the model fit is satisfactory.
- Use contour plots of the response surface to explore the effect of changing factor levels on the response.
- Repeat all the above steps for the second response variable.
- After satisfactory models have been fit to both responses, you can overlay the surface contours for both responses.
- Find optimal factor settings.
Source              Estimate  Std. Error  t value  Pr(>|t|)
------              --------  ----------  -------  --------
Intercept            5.86613     0.41773   14.043  3.29e-05
Pressure            -1.90967     0.36103   -5.289  0.00322
H2/WF6              -0.22408     0.36103   -0.621  0.56201
Pressure*H2/WF6      1.68617     0.71766    2.350  0.06560
Pressure^2           0.13373     0.60733    0.220  0.83442
H2/WF6^2             0.03373     0.60733    0.056  0.95786


Residual standard error:  0.7235 based on 5 degrees of freedom
Multiple R-squared:  0.8716
Adjusted R-squared:  0.7431
F-statistic:  6.787 based on 5 and 5 degrees of freedom
p-value:  0.0278
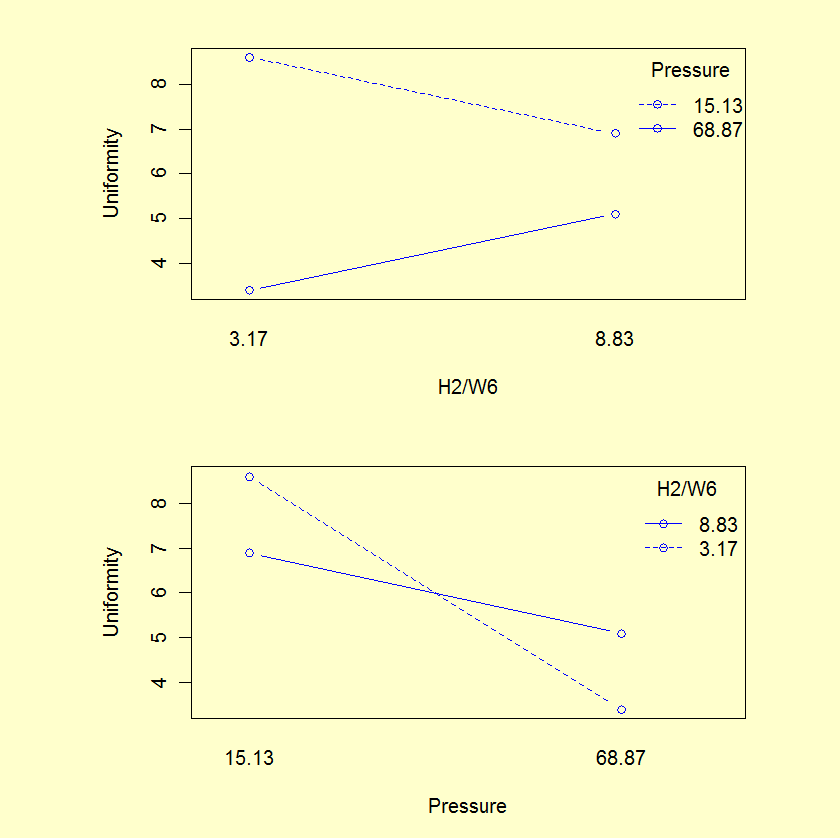
Start:   AIC=-3.79
Model:   Uniformity ~ Pressure + H2/WF6 + Pressure*H2/WF6 + Pressure^2 + H2/WF6^2

Step 1:  Remove H2/WF6^2, AIC=-5.79
Model:   Uniformity ~ Pressure + H2/WF6 + Pressure*H2/WF6 + Pressure^2

Step 2:  Remove Pressure^2,  AIC=-7.69
Model:   Uniformity ~ Pressure + H2/WF6 + Pressure*H2/WF6

Step 3:  Remove H2/WF6,  AIC=-8.88
Model:   Uniformity ~ Pressure + Pressure*H2/WF6
The stepwise routine selects a model containing the intercept, Pressure, and the interaction term. However, many statisticians do not think an interaction term should be included in a model unless both main effects are also included. Thus, we will use the model from Step 2 that included Pressure, H2/WF6, and the interaction term. Interaction plots confirm the need for an interaction term in the model.
Source           DF Sum of Sq  Mean Sq   F value   Pr(>F)
------           -- ---------  -------   -------   ------
Model             3   17.739   5.9130      15.66   0.0017
Total error       7    2.643   0.3776

Lack-of-fit       5   1.4963   0.2993       0.52   0.7588
Pure error        2   1.1467   0.5734


Residual standard error:  0.6145 based on 7 degrees of freedom
Multiple R-squared:  0.8703
Adjusted R-squared:  0.8148


Source           Estimate  Std. Error  t value  Pr(>|t|)
------           --------  ----------  -------  --------
Intercept          5.9273     0.1853    31.993  7.54e-09
Pressure          -1.9097     0.3066    -6.228  0.000433
H2/WF6            -0.2241     0.3066    -0.731  0.488607
Pressure*H2/WF6    1.6862     0.6095     2.767  0.027829
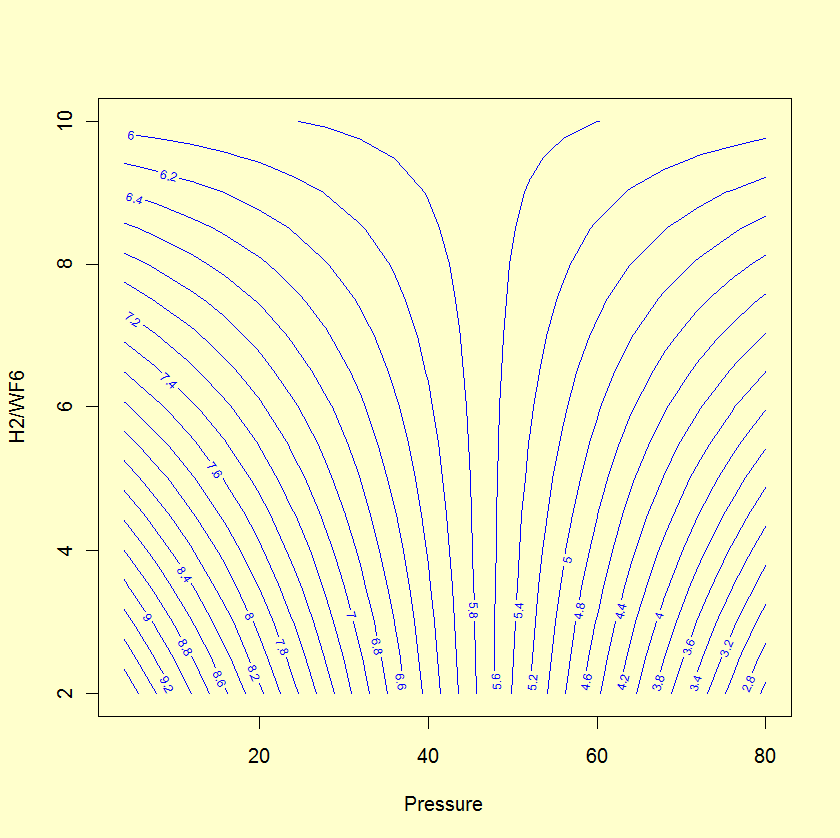
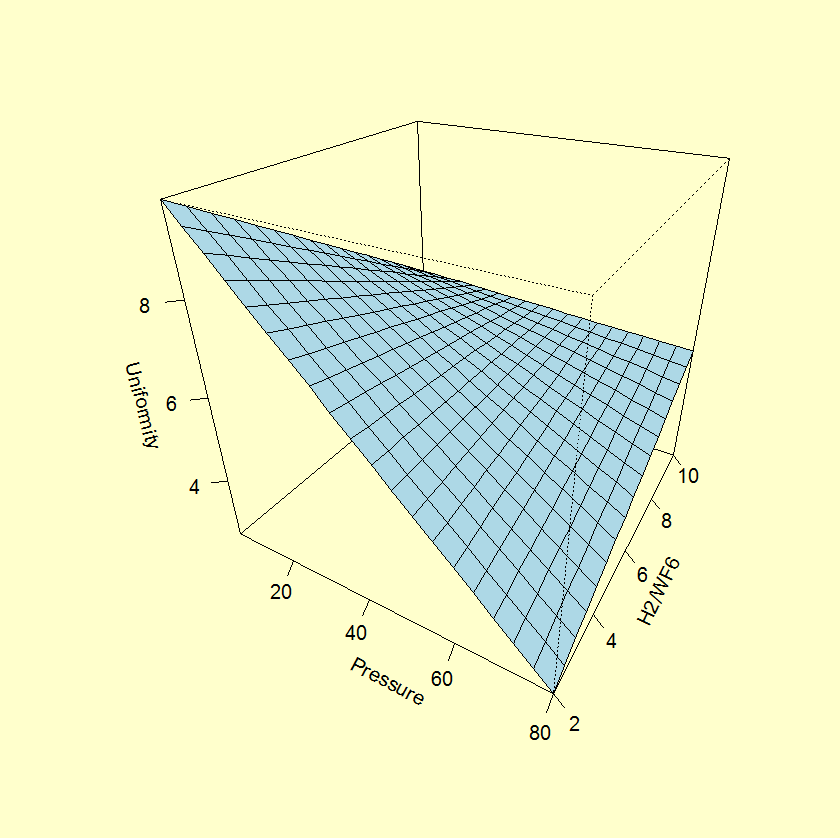
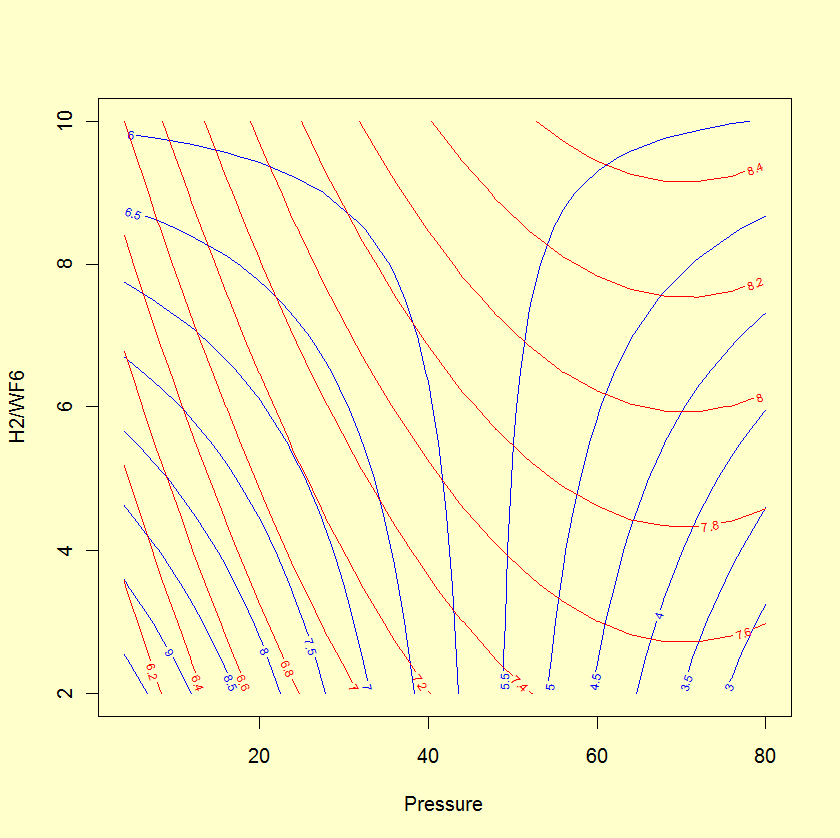
A contour plot and perspective plot of Uniformity provide a visual display of the response surface.
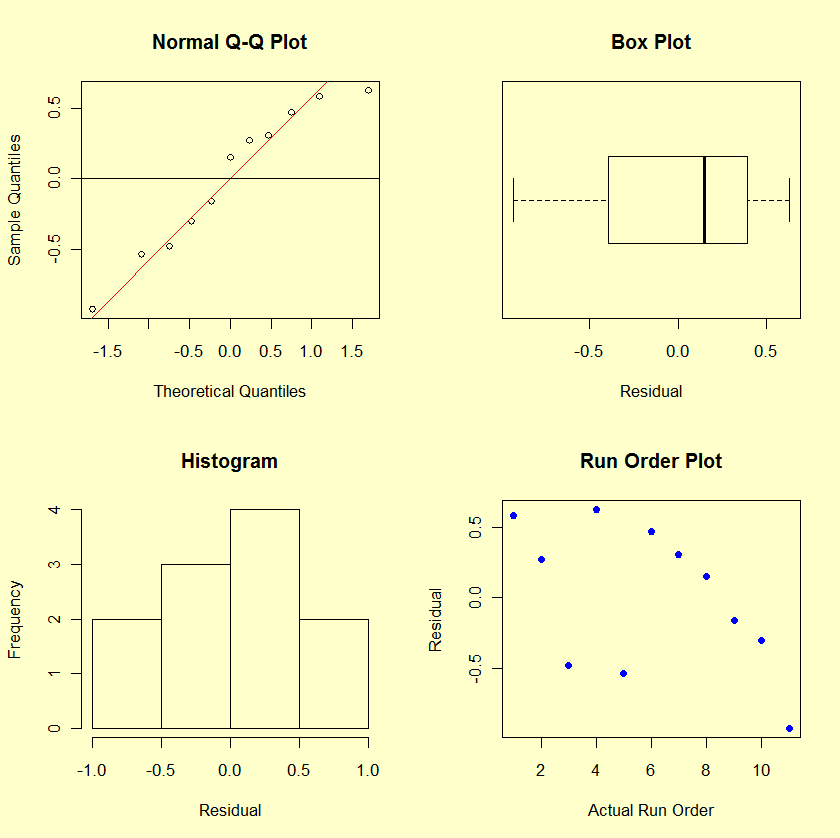
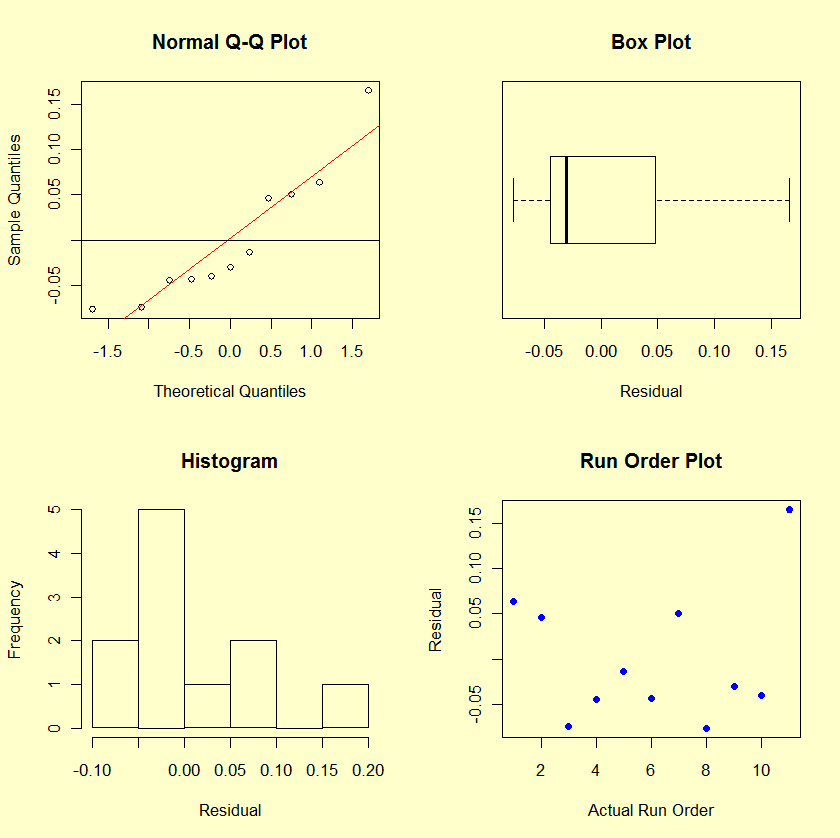
The residual plots do not indicate problems with the underlying assumptions.
- The R2 is reasonable for fitting Uniformity (well known to be a difficult response to model).
- The lack-of-fit test is not significant (very small "Prob > F " would indicate a lack of fit).
- The residual plots do not reveal any major violations of the underlying assumptions.
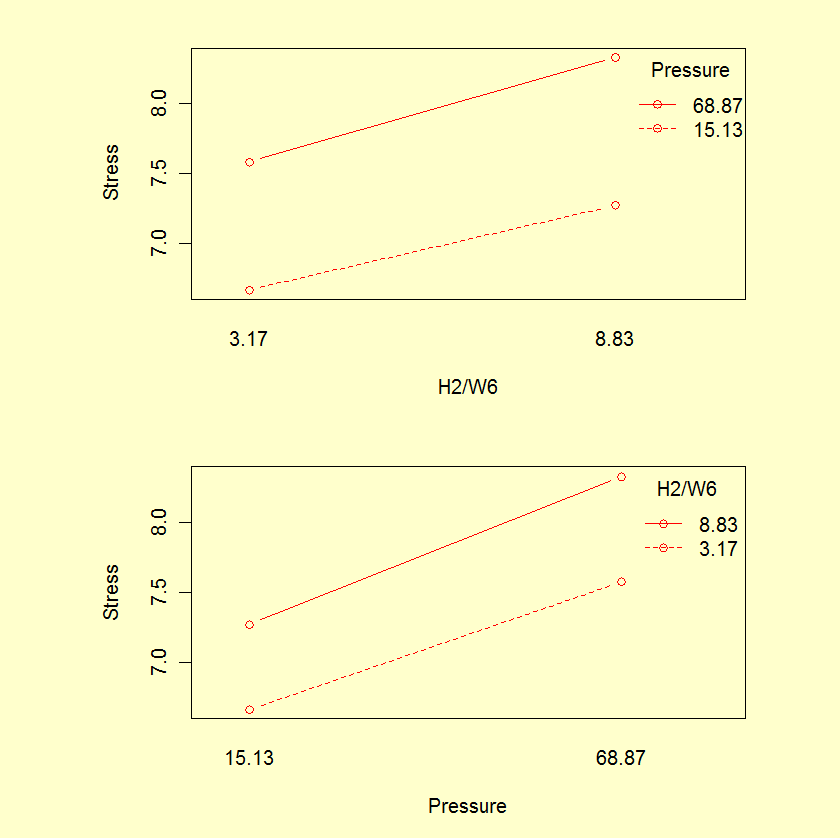
- The interaction plot shows why an interaction term is needed (parallel lines would suggest no interaction).
Source            Estimate  Std. Error  t value  Pr(>|t|)
------            --------   ---------  -------  --------
Intercept         8.056791    0.179561   44.869  1.04e-07
Pressure          0.735933    0.038524   19.103  7.25e-06
H2/WF6            0.852099    0.198192    4.299   0.00772
Pressure*H2/WF6   0.069431    0.076578    0.907   0.40616
Pressure^2       -0.528848    0.064839   -8.156   0.00045
H2/WF6^2         -0.007414    0.004057   -1.827   0.12722


Residual standard error:  0.07721 based on 5 degrees of freedom
Multiple R-squared:  0.9917
Adjusted R-squared:  0.9834
F-statistic:  119.8 based on 5 and 5 degrees of freedom
p-value:  3.358e-05
Start:   AIC=-53.02
Model:   Stress ~ Pressure + H2/WF6 + Pressure*H2/WF6 + Pressure^2 + H2/WF6^2

Step 1:  AIC=-53.35
Model:   Stress ~ Pressure + H2/WF6 + Pressure^2 + H2/WF6^2
The stepwise routine identifies a model containing the intercept, the main effects, and both squared terms. However, the fit of the full quadratic model indicates that neither the H2/WF6 squared term nor the interaction term are significant. A comparison of the full model and the model containing just the main effects and squared pressure terms indicates that there is no significant difference between the two models.
Model 1: Stress ~ Pressure + H2/WF6 + Pressure^2
Model 2: Stress ~ Pressure + H2/WF6 + Pressure^2 + Pressure*H2/WF6 + H2/WF6^2

Source      DF Sum of Sq  Mean Sq   F value    Pr(>F)
------      -- ---------  -------   -------   -------
Model 1      2  0.024802  0.01240      2.08      0.22
Model 2      5  0.029804  0.00596
In addition, interaction plots do not indicate any significant interaction.
The fact that the stepwise procedure selected a model for Stress containing a term that was not significant indicates that all output generated by statistical software should be carefully examined. In this case, the stepwise procedure identified the model with the lowest AIC (Akaike information criterion), but did not take into account contributions by individual terms. Other software using a different criteria may identify a different model, so it is important to understand the algorithms being used.
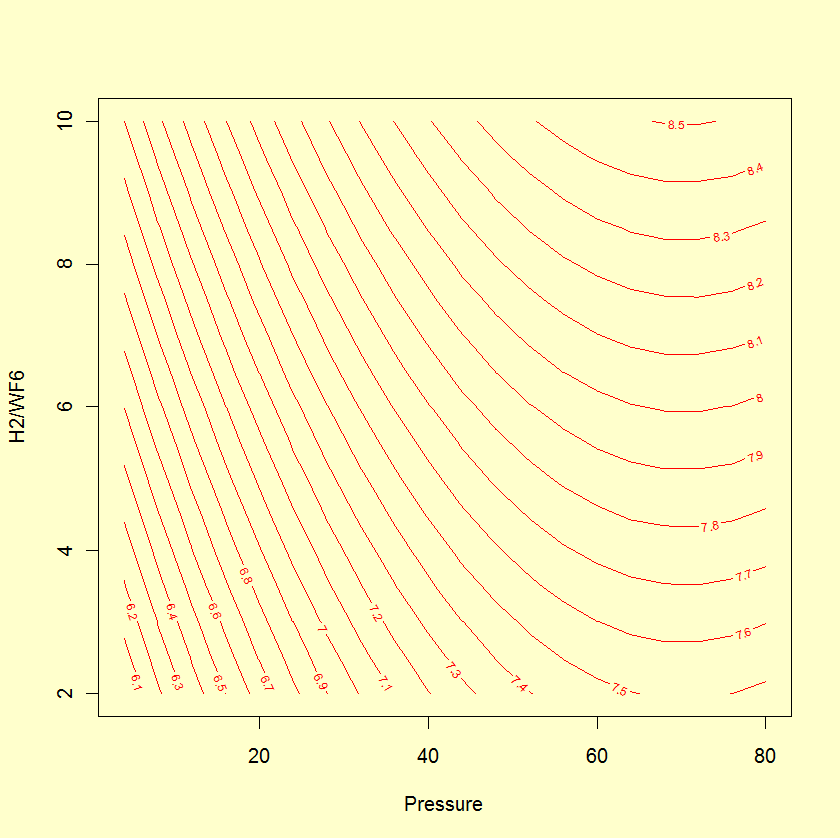
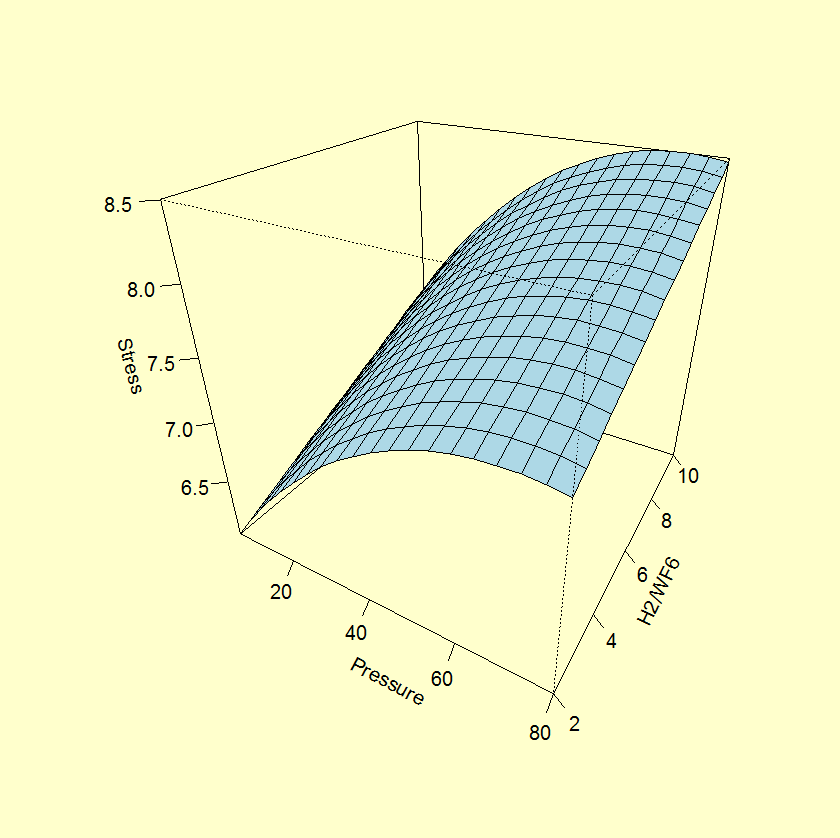
Source           DF Sum of Sq  Mean Sq   F value    Pr(>F)
------           -- ---------  -------   -------   -------
Model             3    3.5454   1.1818     151.5   9.9e-07
Total error       7    0.0546   0.0078

Lack-of-fit       5  0.032405  0.00065      0.58      0.73
Pure error        2  0.022200  0.01110


Residual standard error:  0.0883 based on 7 degrees of freedom
Multiple R-squared:  0.9848
Adjusted R-squared:  0.9783


Source        Estimate  Std. Error  t value  Pr(>|t|)
------        --------  ----------  -------  --------
Intercept      7.73410    0.03715   208.185  1.56e-14
Pressure       0.73593    0.04407    16.699  6.75e-07
H2/WF6         0.49686    0.04407    11.274  9.65e-06
Pressure^2    -0.49426    0.07094    -6.967  0.000218
A contour plot and perspective plot of Stress provide a visual representation of the response surface.
- The R2 is very good for fitting Stress.
- The lack-of-fit test is not significant (very small "Prob > F " would indicate a lack of fit).
- The residual plots do not reveal any major violations of the underlying assumptions.
- The nearly parallel lines in the interaction plots show why an interaction term is not needed.
Uniformity = 5.93 - 1.91*Pressure - 0.22*H2/WF6 + 1.70*Pressure*H2/WF6
Stress = 7.73 + 0.74*Pressure + 0.50*H2/WF6 - 0.49*Pressure2
