5.
Process Improvement
5.3.
Choosing an experimental design
5.3.3.
How do you select an experimental design?
5.3.3.6.
|
Response surface designs
|
|
|
Response surface models may involve just main effects and
interactions or they may also have quadratic and possibly cubic terms
to account for curvature
|
Earlier, we described the response surface method (RSM) objective. Under some
circumstances, a model involving only main effects and interactions
may be appropriate to describe a response surface when
- Analysis of the results revealed no evidence of "pure quadratic"
curvature in the response of interest (i.e., the response at the
center approximately equals the average of the responses at the
factorial runs).
- The design matrix originally used included the limits of the
factor settings available to run the process.
|
|
Equations for quadratic and cubic models
|
In other circumstances, a complete description of the process behavior
might require a quadratic or cubic model:
Quadratic
\( \begin{array}{lcl}
\hat{y} & = & \beta_0 + \beta_1 x_1 + \beta_2 x_2 + \beta_3 x_ 3 +
\beta_{12}x_{1}x_{2} + \beta_{13}x_{1}x_{3} + \\
& & \beta_{23}x_{2}x_{3} + \beta_{11}x_{1}^{2} +
\beta_{22}x_{2}^{2} + \beta_{33}x_{3}^{2}
\end{array} \)
Cubic
\( \begin{array}{lcl}
\hat{y} & = & \mbox{quadratic model} + \beta_{123}x_{1}x_{2}x_{3} +
\beta_{112}x_{1}^{2}x_{2} +
\beta_{113}x_{1}^{2}x_{3} + \\
& & \beta_{122}x_{1}x_{2}^{2} +
\beta_{133}x_{1}x_{3}^{2} +
\beta_{223}x_{2}^{2}x_{3} +
\beta_{233}x_{2}x_{3}^{2} + \\
& & \beta_{111}x_{1}^{3} +
\beta_{222}x_{2}^{3} +
\beta_{333}x_{3}^{3} +
\end{array} \)
These are the full models, with all possible terms, rarely would all
of the terms be needed in an application.
|
|
Quadratic models almost always sufficient for industrial applications
|
If the experimenter has defined factor limits appropriately and/or taken
advantage of all the tools available in multiple regression analysis
(transformations of responses and factors, for example), then finding
an industrial process that requires a third-order model is highly
unusual. Therefore, we will only focus on designs that are useful for
fitting quadratic models. As we will see, these designs often provide
lack of fit detection that will help determine when a higher-order
model is needed.
|
|
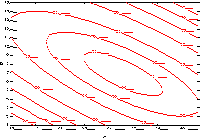
General quadratic surface types
|
Figures 3.9 to 3.12 identify the general quadratic surface types that
an investigator might encounter
|
|
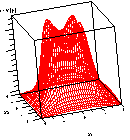
FIGURE 3.9 A Response Surface "Peak"
|
FIGURE 3.10 A Response Surface "Hillside"
|
|
|
|
FIGURE 3.11 A Response Surface "Rising Ridge"
|
FIGURE 3.12 A Response Surface "Saddle"
|
|
|
|
Factor Levels for Higher-Order Designs
|
|
Possible behaviors of responses as functions of factor settings
|
Figures 3.13 through 3.15 illustrate possible behaviors of responses
as functions of factor settings. In each case, assume the value of
the response increases from the bottom of the figure to the top and that
the factor settings increase from left to right.
|
|
|
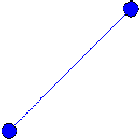
FIGURE 3.13
Linear Function
|
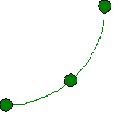
FIGURE 3.14
Quadratic Function
|
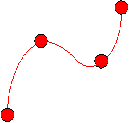
FIGURE 3.15
Cubic Function
|
|
|
A two-level experiment with center points can detect, but not fit,
quadratic effects
|
If a response behaves as in Figure 3.13, the design matrix to quantify
that behavior need only contain factors with two levels -- low and
high. This model is a basic assumption of simple two-level
factorial and fractional factorial designs. If a response behaves
as in Figure 3.14, the minimum number of levels required for a factor
to quantify that behavior is three. One might logically assume that
adding center points to a two-level design would satisfy that
requirement, but the arrangement of the treatments in such a matrix
confounds all quadratic effects with each other. While a two-level
design with center points cannot estimate individual pure quadratic
effects, it can detect them effectively.
|
|
Three-level factorial design
|
A solution to creating a design matrix that permits the estimation of
simple curvature as shown in Figure 3.14 would be to use a three-level
factorial design. Table 3.21 explores that possibility.
|
|
Four-level factorial design
|
Finally, in more complex cases such as illustrated in Figure 3.15, the
design matrix must contain at least four levels of each factor to
characterize the behavior of the response adequately.
|
|
3-level factorial designs can fit quadratic models but they require
many runs when there are more than 4 factors
|
TABLE 3.21 Three-level Factorial Designs
Number
of Factors
|
Treatment Combinations
3k Factorial
|
Number of Coefficients
Quadratic Empirical Model
|
|
|
2
|
9
|
6
|
|
3
|
27
|
10
|
|
4
|
81
|
15
|
|
5
|
243
|
21
|
|
6
|
729
|
28
|
|
|
Fractional factorial designs created to avoid such a large number
of runs
|
Two-level factorial designs quickly become too large for practical
application as the number of factors investigated increases. This
problem was the motivation for creating 'fractional factorial'
designs. Table 3.21 shows that the number of runs required for a
3k factorial becomes unacceptable even more quickly
than for 2k designs. The last column in Table 3.21
shows the number of terms present in a quadratic model for each case.
|
|
Number of runs large even for modest number of factors
|
With only a modest number of factors, the number of runs is very
large, even an order of magnitude greater than the number of parameters
to be estimated when k isn't small. For example, the absolute
minimum number of runs required to estimate all the terms present in a
four-factor quadratic model is 15: the intercept term, 4 main effects,
6 two-factor interactions, and 4 quadratic terms.
The corresponding 3k design for k = 4
requires 81 runs.
|
|
Complex alias structure and lack of rotatability for 3-level
fractional factorial designs
|
Considering a fractional factorial at three levels is a logical step,
given the success of fractional designs when applied to two-level
designs. Unfortunately, the alias structure for the three-level
fractional factorial designs is considerably more complex and harder
to define than in the two-level case.
Additionally, the three-level factorial designs suffer a major flaw
in their lack of
'rotatability.'
|
|
|
Rotatability of Designs
|
|
"Rotatability" is a desirable property not present in 3-level
factorial designs
|
In a rotatable design, the variance of the predicted values of y
is a function of the distance of a point from the center of the design
and is not a function of the direction the point lies from the center.
Before a study begins, little or no knowledge may exist about the
region that contains the optimum response. Therefore, the experimental
design matrix should not bias an investigation in any direction.
|
|
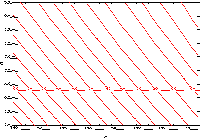
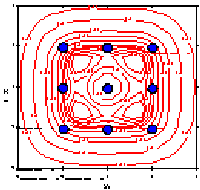
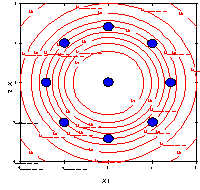
Contours of variance of predicted values are concentric circles
|
In a rotatable design, the contours associated with the variance of
the predicted values are concentric circles. Figures 3.16 and 3.17
(adapted from Box and Draper, `Empirical Model Building and Response
Surfaces,' page 485) illustrate a three-dimensional plot and contour
plot, respectively, of the `information function' associated with a
32 design.
|
|
Information function
|
The information function is:
\( \frac{1}{V(\hat{y})} \)
with V denoting the variance (of the predicted value
\( \hat{y} \).
Each figure clearly shows that the information content of the design
is not only a function of the distance from the center of the design
space, but also a function of direction.
|
|
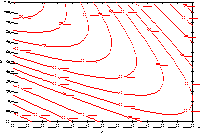
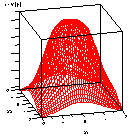
Graphs of the information function for a rotatable quadratic design
|
Figures 3.18 and 3.19 are the corresponding graphs of the information
function for a rotatable quadratic design. In each of these figures,
the value of the information function depends only on the distance
of a point from the center of the space.
|
|
|
FIGURE 3.16 Three-Dimensional Illustration for the
Information Function of a 32 Design
|
FIGURE 3.17
Contour Map of the Information Function for a 32
Design
|
|
|
|
FIGURE 3.18 Three-Dimensional Illustration of the
Information Function for a Rotatable Quadratic Design for Two
Factors
|
FIGURE 3.19 Contour Map of the Information Function
for a Rotatable Quadratic Design for Two Factors
|
|
|
|
Classical Quadratic Designs
|
|
Central composite and Box-Behnken designs
|
Introduced during the 1950's, classical quadratic designs fall into
two broad categories: Box-Wilson central
composite designs and Box-Behnken designs.
The next sections describe these design classes and their properties.
|

