1.3. EDA Techniques
1.3.3. Graphical Techniques: Alphabetic
1.3.3.26. Scatter Plot
1.3.3.26.8. |
Scatter Plot: Variation of Y Does Not Depend on X (homoscedastic) |


|
1.
Exploratory Data Analysis
1.3. EDA Techniques 1.3.3. Graphical Techniques: Alphabetic 1.3.3.26. Scatter Plot
|
|||
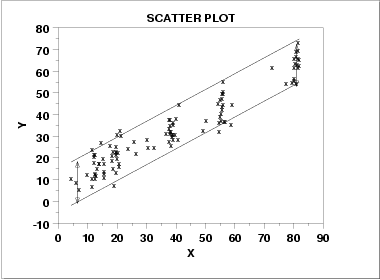
| Scatter Plot Showing Homoscedastic Variability |

|
||
| Discussion | This scatter plot reveals a linear relationship between X and Y: for a given value of X, the predicted value of Y will fall on a line. The plot further reveals that the variation in Y about the predicted value is about the same (+- 10 units), regardless of the value of X. Statistically, this is referred to as homoscedasticity. Such homoscedasticity is very important as it is an underlying assumption for regression, and its violation leads to parameter estimates with inflated variances. If the data are homoscedastic, then the usual regression estimates can be used. If the data are not homoscedastic, then the estimates can be improved using weighting procedures as shown in the next example. | ||
