1.3. EDA Techniques
1.3.6. Probability Distributions
1.3.6.7. Tables for Probability Distributions
1.3.6.7.4. |
Critical Values of the Chi-Square Distribution |
A test statistic with ν degrees of freedom is computed from the data. For upper-tail one-sided tests, the test statistic is compared with a value from the table of upper-tail critical values. For two-sided tests, the test statistic is compared with values from both the table for the upper-tail critical values and the table for the lower-tail critical values.
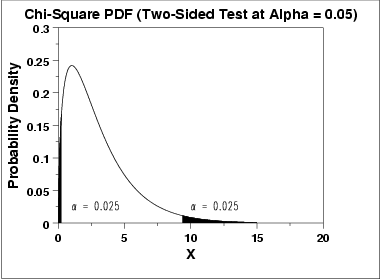
The significance level, α, is demonstrated with the graph below which shows a chi-square distribution with 3 degrees of freedom for a two-sided test at significance level α = 0.05. If the test statistic is greater than the upper-tail critical value or less than the lower-tail critical value, we reject the null hypothesis. Specific instructions are given below.

Given a specified value of α:
- For a two-sided test, find the column corresponding to 1-α/2 in the table for upper-tail critical values and reject the null hypothesis if the test statistic is greater than the tabled value. Similarly, find the column corresponding to α/2 in the table for lower-tail critical values and reject the null hypothesis if the test statistic is less than the tabled value.
- For an upper-tail one-sided test, find the column corresponding to 1-α in the table containing upper-tail critical and reject the null hypothesis if the test statistic is greater than the tabled value.
- For a lower-tail one-sided test, find the column corresponding to α in the lower-tail critical values table and reject the null hypothesis if the computed test statistic is less than the tabled value.

