1.
Exploratory Data Analysis
1.3.
EDA Techniques
1.3.3.
Graphical Techniques: Alphabetic
|
Purpose:
Estimate uncertainty
|
The bootstrap (Efron and
Gong) plot is used to estimate the uncertainty of a statistic.
|
|
Generate subsamples with replacement
|
To generate a bootstrap uncertainty estimate for a given
statistic from a set of data, a subsample of a size less
than or equal to the size of the data set is
generated from the data, and the statistic is calculated.
This subsample is generated with replacement so
that any data point can be sampled multiple times or not
sampled at all. This process is repeated for many
subsamples, typically between 500 and 1000. The computed
values for the statistic form an estimate of the sampling
distribution of the statistic.
For example, to estimate the uncertainty of the median from
a dataset with 50 elements, we generate a subsample of 50
elements and calculate the median. This is repeated at
least 500 times so that we have at least 500 values for the
median. Although the number of bootstrap samples to use is
somewhat arbitrary, 500 subsamples is usually sufficient.
To calculate a 90% confidence interval for the median, the
sample medians are sorted into ascending order and the value
of the 25th median (assuming exactly 500 subsamples were taken)
is the lower confidence limit while the value of the 475th
median (assuming exactly 500 subsamples were taken) is the
upper confidence limit.
|
|
Sample Plot:
|

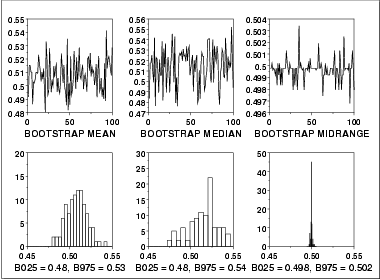
This bootstrap plot was generated from
500 uniform random
numbers. Bootstrap plots and corresponding histograms
were generated for the mean, median, and mid-range. The
histograms for the corresponding statistics clearly show that
for uniform random numbers the mid-range has the smallest
variance and is, therefore, a superior location estimator to
the mean or the median.
|
|
Definition
|
The bootstrap plot is formed by:
- Vertical axis: Computed value of the desired statistic
for a given subsample.
- Horizontal axis: Subsample number.
The bootstrap plot is simply the computed value of the
statistic versus the subsample number. That is, the
bootstrap plot generates the values for the desired
statistic. This is usually immediately followed by a
histogram or some other distributional plot to show the
location and variation of the sampling
distribution of the statistic.
|
|
Questions
|
The bootstrap plot is used to answer the following questions:
- What does the sampling distribution for the statistic
look like?
- What is a 95% confidence interval for the statistic?
- Which statistic has a sampling distribution with the
smallest variance? That is, which statistic generates
the narrowest confidence interval?
|
|
Importance
|
The most common uncertainty calculation is generating a
confidence interval for the mean. In this case, the
uncertainty formula can be derived mathematically. However,
there are many situations in which the uncertainty
formulas are mathematically intractable. The bootstrap
provides a method for calculating the uncertainty in these
cases.
|
|
Cautuion on use of the bootstrap
|
The bootstrap is not appropriate for all distributions and
statistics (Efron and
Tibrashani). For example, because of the shape of the uniform
distribution, the bootstrap is not appropriate for estimating the
distribution of statistics that are heavily dependent on the
tails, such as the range.
|
|
Related Techniques
|
Histogram
Jackknife
The jacknife is a technique that is closely related to the
bootstrap. The jackknife is beyond the scope of this handbook.
See the Efron and Gong
article for a discussion of the jackknife.
|
|
Case Study
|
The bootstrap plot is demonstrated in the
uniform random numbers
case study.
|
|
Software
|
The bootstrap is becoming more common in general purpose statistical
software programs. However, it is still not supported in many of
these programs. Both R software and Dataplot
support a bootstrap capability.
|


